For any non-product related queries, please write to info@perfios.com.
For any non-product related queries, please write to info@perfios.com.


In the digital era, the financial world deals with portable documents in the form of scanned images, pdfs which are digitized to extract the relevant transaction details and then processed for different use cases.
For this, various computer vision and deep learning based methods have shown potential to not only digitize the data efficiently but also to learn important features from the data. These features can then be used for various downstream tasks like understanding customer behavior like their purchase patterns, to identify fraudulent transactions, to process medical claims faster, to summarize invoices, etc.
In order to learn these features using any of the advanced techniques from Machine learning, it is important to organize the data into some structures like tables, bar plots, graphs etc. In fact, we have been using these structures all around.
With the scope of this blog, let’s consider a few examples where we represent data in tabular format. You can think of data that your own gradesheets hold, chemistry reading charts, your grocery invoice, the statement of your bank account etc. Tables are omnipresent, aren't they? Hence, starting from reading scanned documents, identifying tabular regions to digitizing the table content from the scans becomes an important step in the document digitization journey.
Document digitization can be summarized using Fig 1, which starts with a collection of scanned images of financial documents followed by segregation (bank statements, ITRs, salary slips etc). The segregated documents then go for the respective layout understanding module (we consider bank statements as document type and layout understanding as table identification). We also apply OCR correction steps to correct falsely identified words or numbers and finally produce a digitized document of the scanned image.
Information Identification from scanned documents + Converting them to machine-readable format = ‘Document Digitization’
In this blog, we will comprehend ‘digitization of tabular data from bank statements’.
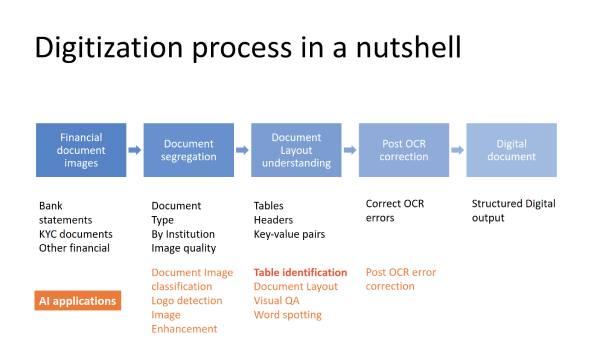
Fig. 1: Document Digitization journey. Table identification is one of the important step in digitization of tabular data
Before we dive into table identification, let's define some terminologies that we will use frequently ahead in this blog.
Table Detection: The task of detecting the table presence and its location in a document image. This might sound like detecting just a rectangle in an image, right? But hang on, we live in a world full of diversity.
Table Structure Recognition (TSR): Once a table has been located, TSR here onwards identifies the structure of the table in terms of rows, columns, cells, merged rows, merged columns etc, and often indexes with unique numbers.
Table Identification: Table identification generally has reference to different contexts but for this discussion we will refer to Table Identification as a task of Table Detection followed by Table Structure Recognition.
Our existing solution to solve this problem can be summarized in the following flow diagram.
A given bank statement image is passed through a deep learning neural network which locates the tables. As a straightforward use case of object detection tasks in computer vision, state of the art methods can be directly adopted to detect tables in bank statements. We have used Yolov5 based architecture to detect these tables. Along with the table coordinates, we also associate them with one of the two classes, viz. Bordered and Borderless; defined with following properties.
A table is bordered if all the row and column separator lines are distinctly present.
Whereas, a table is semi-bordered if at least one of the row or column separator lines is missing or not distinctly present.
Once the location and the class of the table has been identified, the bordered tables are sent to a line detection module to identify rows and column lines. The borderless tables, being comparatively more complicated to identify structures from, are sent to a line generation module where we use text alignments to decide the best possible set of row and column spans.
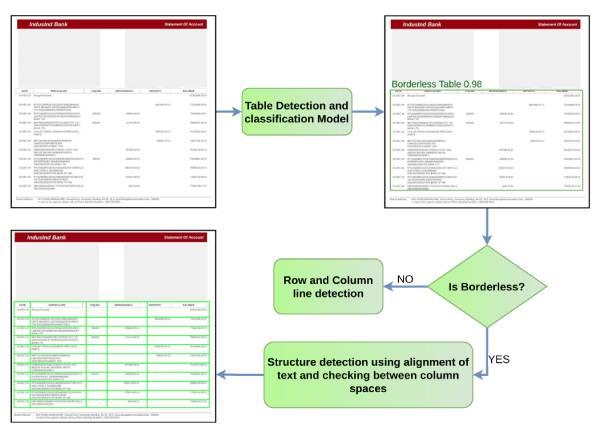
Fig. 2: Existing solution to solve Table Identification task
However, the major challenge remains in identifying the structure of the tables.
For bordered tables, presence of noise or distortion in the scan or capture, causes the line detector to miss out some of the lines. For borderless tables, the problem is even more elevated as noise alters the textual areas, giving false clues about the foreground text and background noise. Given the wide variety of bank statements from various financial institutions, it adds to the complexity of the task. A set of sample results from our method is available here.
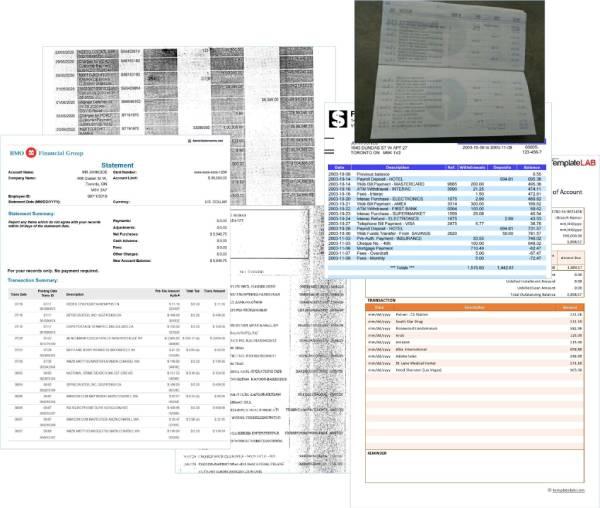
Fig. 3: Various bank statement templates [Source: Templatelab.com] and samples of scans that we receive.
To improve the table structure recognition part, we have to consider three challenges,
● Traditional computer vision methods (Hough lines, edge detections etc), that we use to detect lines, are always limited by the quality of the scan.
● For the semi-bordered tables, we have to use heuristics to mark row and column separators, and these heuristics have to be carefully chosen, which ultimately does not allow us to scale up whenever we onboard a new bank.
● An inherent limitation of the rule based approach, which identifies cells as row and column line intersections, is generation of multi-row or multi-column spanning cells.
To overcome the above-mentioned limitations of traditional computer vision methods, researchers have proposed an interesting idea of considering table structure as node adjacency in graphs. Yes, that’s right, table as a graph, with cells of the table as nodes of the graph. Sounds interesting? Stay tuned for our next article where we will deep dive into table structure recognition using graphs.